1 HR Analytics Dashboard in Power BI
N.B THE DATASET USED IS ENTIRELY FICTIONAL & HAS BEEN GENERATED FOR DEMONSTRATION, TESTING OR EDUCATIONAL PURPOSES. ANY RESEMBLANCE TO ACTUAL COMPANIES, ORGANIZATIONS IS PURELY COINCIDENTAL
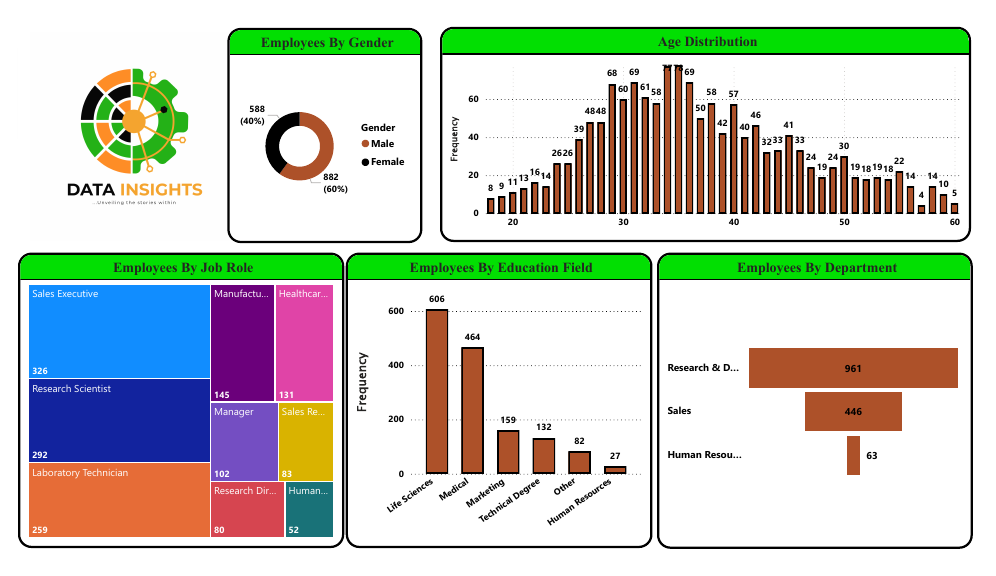
This dashboard provides the HR department with a single, unified platform to analyze and understand the organization’s workforce, enabling data-driven decisions to drive business success. The dashboard features five key visuals:
Visuals:
- Age Distribution: A bar chart displaying the distribution of employees across different age groups, helping identify potential succession planning needs.
- Employees by Gender: A pie chart showing the proportion of male and female employees, enabling monitoring of gender diversity.
- Employees by Job Role: A treemap visualizing the number of employees in each job role, facilitating workforce planning and resource allocation.
- Employees by Education Field: A bar chart illustrating the distribution of employees by educational background, informing training and development initiatives.
- Employees by Department: A flunnel displaying the number of employees in each department, supporting organizational design and restructuring decisions.
Benefits:
- Enhanced workforce planning and talent management
- Improved diversity and inclusion monitoring
- Data-driven decisions for training and development initiatives
- Better organizational design and resource allocation